Student Success is at an all-Time High: Understanding U.S. Graduation Rates in Context
Alexandros M. Goudas (Working Paper No. 9) March 2018
If you read articles on postsecondary education, you know that graduation rates are consistently being characterized as low. People like to compare higher education to factories (Belfield & Crosta, 2013; Schneider, 2008). If someone told you that a widget factory was only successfully completing 50% of their widgets, you might say the factory is not worth investing in. You might say its business model is a failure. Similarly, you might hear that four-year colleges only graduate about half of all students who enroll, and you might think that these institutions are failures as well. Once you view a college like a factory, you want to assess it and reform it like a factory.
Compounding the problem, like the NBC article entitled “Just Over Half of All College Students Actually Graduate, Report Finds” (Chuck, 2015), people who write about the subject often include terms such as “just” and “only” in titles and sentences before citing certain percentages that appear low to outside observers. Cooper (2017) is yet another article that contains”just” before a postsecondary completion rate, and the title of the article has the word “disappointing” in it.
Sometimes organizations even refer to these numbers as being a “crisis in higher education” (Itzkowitz, 2018). The same organization in another post compared postsecondary education to a leak in a pipeline by stating, “It looks like the higher education portion of the pipeline has sprung a major leak” (Hiler, 2018, video, 0:40). With the use of the idea of a “leaky pipeline,” it appears as if students in the past were more easily able to go from high school to college and finish without dropping out, and that somehow what the data show in higher education right now is worse or abnormal.
However, to understand whether current postsecondary graduation rates are high or low, normal or abnormal, one must place them into a more historical and contextual progression. That progression should include data on high school enrollment-to-completion, as well as college enrollment-to-completion, and ideally this data should go back many decades. This would add context to any random completion metric such as a 50% graduation rate. Fortunately, there are several sources that provide a great deal of context for these numbers. That way we can understand graduation rates better. It turns out that most negative interpretations of current graduation rates do not accurately reflect contextualized data. These rates are actually much better than they appear.
Four-Year Public Graduation Rates Over Time
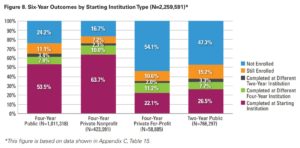
The most common way most people view graduation rates is to take a cohort of students, track them at a particular type of institution, and look at a snapshot of the percent who graduated out of the percent who started. Usually the timeframe for analyzing a four-year degree rate is six years. Using this method, after adding up the completion numbers in the left column in Figure 8 below, one can see that current four-year public college graduation rates hover around 65% (Shapiro et al., 2017, p. 4). This chart comes from data tracked by the National Student Clearinghouse Research Center, which is one of the best sources for completion data available:
To put snapshot completion rates in context, however, one could look at the total population aged 25 and higher who has a bachelor’s degree and track it over time. This data is different from the type of analysis the NSCRC did above. It simply tries to ascertain what percentage of all U.S. citizens has a four-year degree, ages 25 and higher (U.S. Census Bureau, 2017):
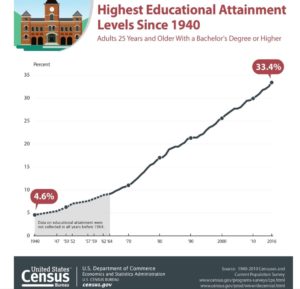
The U.S. Census data (2017) above show that 33% of the total population of adults in the U.S. has a four-year degree, the highest it has ever been since data started being collected in this fashion. Something that is important to understand is that even though there are substantially more students enrolling in college over these decades, the slope of this graduation rate has remained the same. That means millions more students are entering college, yet the graduation rate has remained the same or actually increased.
Another way to demonstrate how graduation rates are actually increasing over time is to view them in the context of large demographic groups. If one were to break down total four-year graduates by generation, for instance, millennials have the highest ever rate at 40% (Graf, 2017):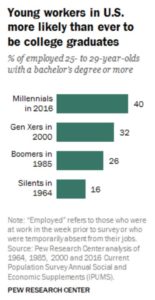
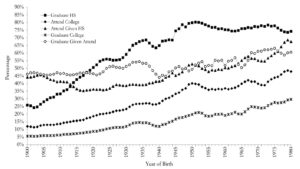
Going back even further, Heckman and LaFontaine (2010) track high school graduation, college enrollment, and college completion at four-year institutions from cohorts in longitudinal data starting in 1900. The bottom marker below is the number of college graduates out of the population who attended college. There was a period of stagnation in the 1950s and 60s, but since then, college completion rates are still the highest they have ever been (Figure V, p. 25):
High School Graduation Rates Over Time
There is a very high correlation between the number of high school graduates and the number of college graduates. It is safe to assume that the more students graduate high school, the more enter college, and the more graduate. The chart above (Heckman & LaFontaine, 2010) also includes high school graduation rates.
Even though they level off in birth cohorts from 1950 onward in that chart, more recent analyses suggest that high school graduation rates are still increasing. For example, below is a different U.S. Census Bureau chart showing both high school and college graduation data from the 1940s through 2015 (Ryan & Bauman, 2016, p. 4):
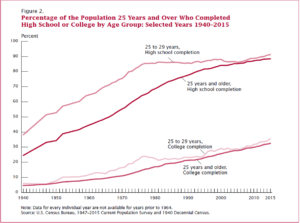
Furthermore, according to the U.S. Department of Education’s most recent data on high school graduation, it appears that more students are completing than ever before, with the total rate near 90% (McFarland et al., 2017, p. 43). However, after these numbers are adjusted, the actual graduation rate is closer to 83%, still the highest it has ever been (p. xxix). Below is a chart, and here is a link to read more about it from NPR:
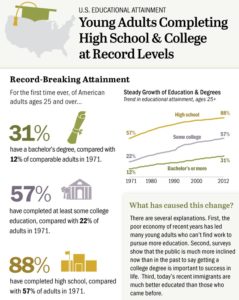
The Pew Research Center (2012) provided yet another chart demonstrating the overall increase in graduation rates for all levels, tracking the data from the early 1970s through 2012. Yet again, researchers are coming to the same conclusion about the highest ever graduation rates:
Two-Year Public College Graduation Rates
Longitudinal data for two-year public colleges is not as readily available as it is for four-year colleges. However, one can extrapolate from charts such as the one below from the U.S. Census Bureau. Usually researchers categorize students into groups such as “some college,” “associate’s degree or higher,” and “bachelor’s degree.” When the number of bachelor’s degree recipients is subtracted from the “associate’s degree or more” number, one can find the total number of adults who hold an associate’s degree. Using this method, approximately 10% of all adults aged 25 and older have an associate’s degree (Ryan & Bauman, 2016, p. 2).
If other students with certificates from two-year and technical colleges were included, this rate would be higher. In fact, using more data from the U.S. Department of Education’s The Condition of Education, one finds that the numbers of certificates and associate’s degrees attained are similar, and both are increasing overall. Figure 1 below shows that the overall rate of certificate and associate’s degree completion has been rising, just like high school and four-year completion metrics, and is at an all-time high:
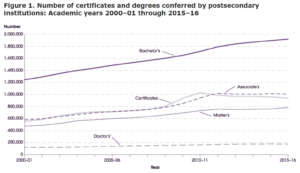
On a side note, the reason why there was a bump and subsequent decline in associate’s degrees and certificates around 2010 onward is because of the Great Recession. It is well established that recessions cause students to attend college in greater numbers, especially young men, thus increasing total number of associate’s degrees and certificates, but also decreasing the proportion of degrees attained.
What This All Means
The most important takeaway from this data is that the U.S. is doing better than it probably ever has in terms of graduation rates, whether it is high school, two-year, or four-year college. Even the number of people with graduate degrees is higher than ever before. People need to realize where we have come from in order to appreciate how difficult it is to affect postsecondary attainment in the short-term.
However, no one should interpret this data to mean that we have achieved a level that is acceptable and that nothing needs to be done to improve these numbers. Clearly, there are demographic gaps in current completion rates that we need to address. Moreover, even though the U.S. has a relatively high postsecondary attainment rate when compared to OECD countries, there are still steps we can take to improve our rates. Almost everyone would agree that almost all higher education attainment is a good thing. Only in the case of predatory institutions that burden students with debt and no degree can one say that it is not helpful.
Paradoxically, the perception that graduation rates are too low, especially among some of the media and others in education, may contribute to improvements in completion. It just may spur society to keep working to minimize gaps, especially among students of color and poor and at-risk students. However, the downside to persistent negative press on higher education completion rates may be that states cut even more funding and weaken support for postsecondary institutions.
After hearing about how higher education is failing repeatedly, lawmakers and researchers may also continue to promote and implement extreme reforms such as eliminating remedial courses and attempting to fast-track everything, even high school (i.e., how dual enrollment is being pushed beyond its traditional model), and this may harm student success in the long run. There may be a great deal more unintended consequences as a result of the dogged drumbeat proclaiming that higher education is continuously failing. In fact, the public may wish to stop supporting unproductive widget factories if they view higher education in this manner.
Using the charts above and other longitudinal completion data in context, however, the media, educators, lawmakers, and policy experts should be able to view graduation numbers as an improvement over the past. They are indeed higher than they have ever been before. Nonetheless, we still need to keep applying thoughtful and well-supported holistic approaches to increasing something that is objectively quite difficult to attain for much of the population.
References
Belfield, C. R., & Crosta, P. M. (2013, April 19). A better factory model. Inside Higher Ed. https://www.insidehighered.com/views/2013/04/19/measures-college-efficiency-too-often-ignore-full-chain-production
Just over half of all college students actually graduate, report finds. NBC News. https://www.nbcnews.com/feature/freshman-year/just-over-half-all-college-students-actually-graduate-report-finds-n465606
College completion rates are still disappointing. Forbes. https://www.forbes.com/sites/prestoncooper2/2017/12/19/college-completion-rates-are-still-disappointing/#5e5eae60263a
Graf, N. (2017, May 16). Today’s young workers are more likely than ever to have a bachelor’s degree. The Pew Research Center. http://www.pewresearch.org/fact-tank/2017/05/16/todays-young-workers-are-more-likely-than-ever-to-have-a-bachelors-degree/
Heckman, J. J., & LaFontaine, P. A. (2010). The American high school graduation rate: Trends and levels. The Review of Economics and Statistics, 92(2). http://www.ncbi.nlm.nih.gov/pmc/articles/PMC2900934/pdf/nihms-117813.pdf
Hiler, T., Siegel, N., & Whistle, W. (2018, February 18). Higher ed’s leaky pipeline. The Third Way. https://www.thirdway.org/video/higher-eds-leaky-pipeline
Itzkowitz, M. (2018, February 1). New data further cements completion crisis in higher education. The Third Way. https://www.thirdway.org/memo/new-data-further-cements-completion-crisis-in-higher-education
McFarland, J., Hussar, B., de Brey, C., Snyder, T., Wang, X., Wilkinson-Flicker, S., Gebrekristos, S., Zhang, J., Rathbun, A., Barmer, A., Bullock Mann, F., and Hinz, S. (2017). The condition of education 2017 (NCES 2017- 144). U.S. Department of Education, National Center for Education Statistics. https://nces.ed.gov/pubs2017/2017144.pdf
Pew Research Center. (2012, November 5). Higher achievements: U.S. high school and college completion rates continue to climb. http://www.pewsocialtrends.org/2012/11/05/us-high-school-and-college-completion-rates-continue-to-climb/
Ryan, C. L., & Bauman, K. (2016). Educational attainment in the United States: 2015 (Release Number: P20-578). U.S. Census Bureau. https://www.census.gov/content/dam/Census/library/publications/2016/demo/p20-578.pdf
Schneider, M. (2008). The costs of failure factories in American higher education. American Enterprise Institute for Public Policy Research. https://pdfs.semanticscholar.org/32cc/c23bc90adf9c1a6662bdfdcd09172347c52a.pdf
Shapiro, D., Dundar, A., Huie, F., Wakhungu, P. K., Yuan, X., Nathan, A., & Bhimdiwali, A. (2017). Completing college: A national view of student completion rates – fall 2011 cohort (Signature Report No. 14). National Student Clearinghouse Research Center. https://nscresearchcenter.org/wp-content/uploads/SignatureReport14_Final.pdf
U.S. Census Bureau. (2017, March 30). Highest educational levels reached by adults in the U.S. since 1940 (Release Number: CB17-51). https://www.census.gov/newsroom/press-releases/2017/cb17-51.html