Remediation is Not a Barrier: Confusing Causation with Correlation
Alexandros M. Goudas (Working Paper No. 2) January 2017 (Updated March 2018)
If asked, I would be the first person to proclaim that postsecondary remedial graduation rates are too low. However, I also seem to be the first to point out that these rates are completely normal: They are exactly what one should expect within the context of all U.S. college graduation rates. In other words, once factors such as minority status, part-time status, and open enrollment institution type are considered, students who take remedial courses have very similar chances at graduating when compared to similar students who are not required to take remedial courses. This does not suggest that remediation is holding students back more than any other potential risk factor.
Unfortunately, however, for nearly a decade now the idea that remedial courses are a barrier has taken over higher education. Many educators, news articles, policy experts, advocacy groups, research centers, and legislators repeat this claim to the point that no one seems to question it. Also, because this sentiment is becoming accepted as true, even by some educators in the field, remediation is being restricted, excessively reformed, or cut entirely. It is clear that the data underlying this claim must be explored further. Without this analysis, one runs the risk of claiming that since remedial students take remedial courses first, and these students have low graduation rates, it must be because of those remedial courses. This may be confusing causation with correlation.
First, the term barrier must be defined. Many reports claiming that remediation is a barrier have cited low numbers of success and high rates of dropouts. A few of them can be read here, here, here, and here. However, very few of these reports include any comparison data. For example, the first article (Gordon, 2016) stated, “Just 16 percent of students placed in developmental education earn a certificate or associate degree in six years” (para. 3). However, it does not cite what percent of similar nonremedial students, according to age, race, income level, full- or part-time status, also graduate in six years. Is it 18%, 30%, or more?
The middle two links fail to refer to any comparison data as well. However, in the last link, the Community College Research Center (CCRC) (Jaggars & Stacey, 2014) claimed, “Only 28 percent of community college students who take a developmental education course go on to earn a degree within eight years” (p. 1), and in an end note, they cited a comparison figure of 43% for nonremedial students (p. 6).
In order to figure out if 16% (in six years) and 28% (in eight years) are abnormally low numbers, the baseline or comparison data need to be known. If it were true that remediation is a barrier, then it would also be true that only remedial students as a demographic would have low completion rates, and all other groups would have much higher rates, because as a barrier, remedial courses would be holding their students back almost completely. Researchers should look at some more completion rates in context, then, to see whether this indeed is the case.
The best overall graduation data currently comes from the National Student Clearinghouse Research Center’s Signature Reports (NSCRC). The reason why it is the best data is because they track students when they transfer and complete at other institutions, and they track part-time students as well. The National Center for Education Statistics’ (NCES) IPEDS data, by contrast, typically only tracks first-time, full-time (FTE), degree-seeking students. At community colleges, this may exclude up to two-thirds or more of all students, many of whom are remedial students. The NSCRC cohorts number in the millions as well, they are independent and a nonprofit, and other reputable organizations cite them regularly. It can be considered reliable data.
The NSCRC’s latest longitudinal report (Shapiro et al., 2017) tracked cohorts of students who first enrolled in any institution type in the year 2011. It is the sixth annual report of its kind, and one of the best parts about it is that it uses the same metrics, and even the same figure numbers, so that one can easily analyze changes over time. It also uses six-year outcomes, which means it tracks all students for six years, instead of three or four, so that a more accurate picture of graduation rates can be understood. Only a small percent of students actually graduate within the nominal time frames (2-year degree in two years; 4-year degree in four years), so calculating graduation in a 150% of these times is conventional now.
Looking at Figure 28 in the NSCRC (2017) report, indeed there is a distinct gap between the completion rates of exclusively part-time students and exclusively full-time students in two-year public colleges (p. 26). These numbers have not changed much in the six annual reports, so it is safe to assume that these numbers could be reliable baseline data.
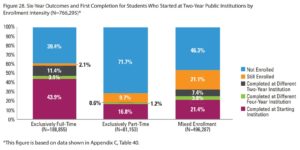
What this means is that it is completely normal for exclusively part-time students in two-year colleges to graduate at a rate of 18.6% (number calculated by adding the three “completed at” categories). For students who are mixed-enrolled, meaning both part-time and full-time, that number moves up to 32.6%. Entirely full-time students have a whopping 58.4% completion rate after six years. Keep in mind that during these six years, about 10% of two-year public college students were exclusively part-time , 65% were mixed-enrolled, and 25% were exclusively full-time. I would argue, however, that once the mixed-enrolled group is disaggregated and categorized, one would see far more students who could be considered more part-time students than full-time, and their graduation rates would slope downward as their part-time proportion increased. In fact, the American Association of Community Colleges puts the percent of part-time students in community colleges at 62%.
19%, 33%, 59%: These two-year public graduation rates clearly show a pattern. The more part-time a student is, the more difficulty that student has graduating from college. Full- and part-time status is just one factor associated with graduation rates. It is well known that minorities have lower graduation rates when compared to whites; that poor students have lower rates when compared to wealthy students; and that students with parents who do not have postsecondary degrees have lower rates than students with parents who have those degrees. In other words, within this pattern, one could easily create subcategories that are consistent. For example, within the category of exclusively part-time students, students with minority status would have lower completion rates than the average part-time rate. As another example, students whose parents lack postsecondary degrees (first-generation students) have higher dropout rates.
The same pattern can be found in four-year institutions (see Figure 3). This time the factor being analyzed is an institution’s acceptance rate. What percent of applicants do institutions accept, and how is it affect their graduation rates? According to the USDOE (2017) annual report entitled The Condition of Education 2017, the pattern is quite clear. If an institution accepts all students who apply, their six-year graduation rate is only 32%. If they only accept 25% or less of all the students who apply, that completion number rises to an astounding 88% (p. 270). There is a direct linear relationship between acceptance rates and graduation. On a side note, currently about 28% of four-year colleges accept all student applicants (McFarland et al., 2017); these institutions are termed “open admissions” (p. xxxviii).
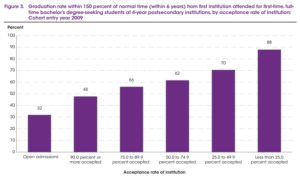
An acceptance rate is a proxy for many factors such as SAT and ACT scores, etc., and these scores are proxies for parental income and education, probably the strongest predictors of college graduation (Cahalan et al., 2017). In other words, the more an institution selects for higher-performing students, the better those students perform.
So these patterns demonstrate that part-time status and admission rates are factors highly correlated with graduation rates in postsecondary students. Does this mean that part-time status is causing students to not graduate, and that full-time status is causing other students to complete at a higher rate? Or, does this mean that the open admissions acceptance rate of a four-year college is actually causing students to complete at a lower rate? It would confuse causation with correlation to imply that any of these associations are actually causing low completion rates. The only causation pattern one can glean from the data here is that accepting the highest-performing students (and paying for them to go to college) will certainly increase graduation rates. Regarding low completion rates, clearly this pattern suggests that other factors are at play here.
Helping to solve the question about remedial graduation rates in particular, recently published research from the National Center for Education Statistics (NCES) provides in-depth numbers on remedial students after tracking them for six years. Their report entitled “Remedial Coursetaking at U.S. Public 2- and 4-year Institutions: Scope, Experiences, and Outcomes” (Chen, 2016) showed that half of all remedial students in their sample (n=12,800) completed their entire remedial course sequence (p. 22). Of those who completed these courses, 42.6% of them graduated from a two-year or a four-year college after six years, which is higher than the graduation rate of nonremedial students (38.9%) in the same time frame (p. 162).
If all types of remedial students are taken together as a group (completers, partial completers, and noncompleters), then the average graduation rate is 32.7% after tracking them for six years (this data will soon be found on the NCES’s user requested tables website). If that metric were extended to eight years, it is possible that the remedial graduation rate from two-year public colleges could be as high as 35 to 37%. This is in stark contrast to Bailey et al.’s findings of 28%. Of course, Bailey et al.’s (2010) paper was based on Achieving the Dream (ATD) college data, and those colleges tend to have more underprepared students than average. Therefore, the NCES’s findings may be a more reliable indicator of actual remedial graduation rates.
Thus, the best number to use as a basis for discussions on remedial graduation rates is 33%, or 1/3rd, within a time frame six years. For comparison, the overall graduation rate for all two-year students within six years is approximately 38% (Shapiro et al., 2017). Given that two-year public remedial graduation rates are proportionately lower than the average, and they are more similar to mixed-enrollment completion rates, it is difficult to argue that remediation is the barrier that so many are claiming it is.
To be consistent, researchers should also cite the 32% graduation rate of open admission four-year public institutions and claim that the courses these students take first are barriers to be reformed. The current average six-year graduation rate of students at four-year institutions (Shapiro et al., 2017) is 64.7% (p. 14). Since four-year enrollments are almost twice as high (13.3 million compared to 7.2 million for two-year colleges), the low four-year graduation rates of open admissions colleges, which comprise well over a quarter of all four-year institutions, could be considered more of a problem than low remedial completion rates.
Therefore, when taken in the context of higher education completion rates, remedial graduation rates are indeed low, but they are in line with what is to be expected. It also appears that the label of “barrier” for remediation is not consistently applied to other types of institutions and other categories of students. Indeed, it may just be that for underprepared students, completion rates are completely in line with what is to be expected given the number of factors contributing to their at-risk status: part-time, minority, nontraditional age, lower quality K12 preparation, single parent, SES, etc.
Many other researchers have come to similar conclusions based on their own research into remedial completion rates. For example, Attewell et al. (2006), in an oft-cited article entitled “New Evidence on College Remediation,” make many statements supporting remediation’s successes. In this quote, Attewell et al. refer to Adelman’s (1999) prior research and findings:
Less well-known than these figures on remediation and noncompletion is Adelman’s finding that college remediation ceases to predict graduation, once a measure of secondary school academic performance and preparation is added to the model (1999, p. 75). This implies that poor high school preparation, rather than taking remedial coursework, is what reduces students’ chances of graduating from college. (p. 889)
Adelman’s (1999, 2004) conclusion comes straight to the heart of the matter. The blame for remedial students’ low completion rates should not rest on the shoulders of remedial courses. Rather, the backgrounds and situations of underprepared students largely determine their completion outcomes.
As further support for this assertion, Attewell et al. (2006) went on to state,
Students who took remediation at a two-year college had significantly lower graduation rates than students at the same kind of institution who did not take remedial coursework. However, after we add controls for family background and academic performance in high school, this effect is reduced to nonsignificance, in both logistic and propensity models. We interpret this as meaning that taking one or more remedial courses in a two-year college does not, in itself, lower a student’s chances of graduation. Causal factors that do reduce one’s chances of graduating include low family SES, poor high school preparation, and being Black, but not college remediation per se. (p. 905)
Other researchers have found similar conclusions regarding the success of remediation. For instance, Peter Bahr of the University of Michigan found that
skill deficient students who attain college-level English and math skill experience the various academic outcomes at rates very similar to those of college-prepared students who attain college-level competency in English and math. Thus, the results of this study demonstrate that postsecondary remediation is highly efficacious. (p. 199)
Regarding graduation as a specific outcome, an ACT research paper (Noble & Sawyer, 2013) found that when analyzing the “developmental students typically completed a Bachelor’s degree in six years at a rate similar to or higher than that of non-developmental students in five years” (p. ii). What this means is that since remedial students have to take more classes than nonremedial students and are more likely to be part-time, it would make sense that they take a little longer to graduate. If remediation were in fact a barrier, then remedial students would never attain similar graduation rates as nonremedial students, much less one year later.
The most important point that needs to be addressed regarding the barrier argument has to do with first-year, first-semester, nonremedial courses. Many articles are quick to point out how few students make it through their first remedial course. However, as noted, few articles note comparison data, such as the passrates of first-year, first-semester nonremedial courses. In fact, few sources cite any first-year course passrates at community colleges or universities. In a rare article, The Education Trust organization asked for and received passrates of some four-year institutions’ first-year nonremedial math courses (see Table 7).
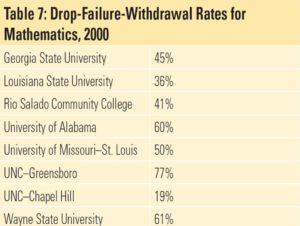
These eight institutions’ first-year passrates average below 50%. Looking at the University of Alabama in particular, EdTrust also published an analysis of their remedial course passrates compared to their first-year nonremedial course passrates (see Table 6; Math 100 and Math 110 are nonremedial).
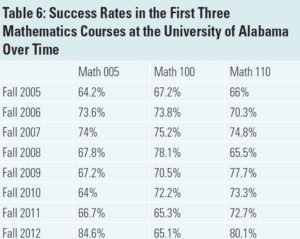
What this shows is that over the span of eight years at the UA, remedial course passrates were very similar to nonremedial course passrates. Both types of courses, remedial and nonremedial, are therefore barriers. If the remedial courses were the only ones to be a barrier, then the passrates of these remedial courses would have been far lower than the college-level course passrates.
In another article, Zeidenberg, Jenkins, and Scott (2012) from the CCRC explore courses other than gateway math and English. They concluded that in spite of
the focus on college math and English, we found that many introductory college-level courses in other subjects also served as obstacles to completion for many students, and these latter courses posed obstacles just as great as college math and English. (p. 28)
They include Biology I and II, psychology, sociology, U.S. History I and II, computer applications, and others on a list of courses creating obstacles in community colleges. More importantly, they find that “success in gatekeeper math and English is no more associated with completion than is success in the other courses” (p. 28). On a side note, this study also found that among students who graduated, there was no difference between the grades of remedial students and nonremedial students (p. 20). If many gateway courses are equal barriers to graduation, and there is no difference between remedial and nonremedial completers, then how can remediation be a barrier?
The natural response to a perceived barrier is to remove it as quickly as possible. Remediation has been classified as a barrier in many reports, and this is why it is being subject to hasty reforms. However, no researcher or policy expert is looking at any low passrates of first-year, first-semester college-level biology courses, for example, and arguing that they should be eliminated, fast-tracked, or combined with Biology II courses. Nor does one read news articles entitled, “Yet Another College-Level Course Found to be a Barrier at Community Colleges, This Time Psychology.” It is unthinkable to make these arguments about anything other than remediation. Instead of applying reforms to most initial college-level courses, researchers only seem to bemoan the low graduation rates of college students in general. For some reason, the cause of low graduation rates has been attributed almost exclusively to remedial courses, which just happen to be the first set of courses many students take at community colleges and universities.
It turns out that college itself is the barrier. As national retention rates demonstrate (National Student Clearinghouse Research Center, 2015), just below 70% of first-time students who enroll at four-year public institutions in a fall semester return the following fall semester, with part-time students near 40%. At two-year public institutions, fall-to-fall retention rates are around 47%, with part-time students lower than 40% (p. 6). In fact, college dropout rates are steepest from from the first semester to the second semester (Aldeman, 2009; Bowen et al., 2009; National Student Clearinghouse Research Center, 2015; Schneider, 2010). Researchers who simply look at remedial course outcomes—even just the students at the cutoffs of these courses—and then conclude that these courses are the main barriers, are making a classic error in data analysis, confusing causation with correlation.
If remediation is a barrier, then any course that any student takes is also a barrier, especially one taken in the first semester of college. And the more college courses students take, the higher the chances they have at dropping out. Of course, at-risk students carry more potential barriers with them than other students when they begin college. That is why limiting or removing access to fundamental prerequisite courses at four-year and two-year colleges is not the answer. In fact, the opposite should occur. Substantial resources should be infused into remedial courses in order to improve them, while linking them with an entire network of well-supported areas in colleges, such as admissions, counseling, tutoring, student success, financial aid, etc.
This is what separates developmental education from remediation. Even though most researchers use the terms interchangeably, the original theory and model of developmental education, as defined by experts in the field, has always been meant to include more than remedial courses alone. It is a system or network of supports, well-funded and thoughtful, which includes remediation, especially prerequisite, traditional remediation for those students who are underprepared.
An excellent example of developmental education in practice already exists. It is called the Accelerated Study in Associate Programs (ASAP), and it is housed at the City University of New York. They invest thousands of dollars per student per year, form a network of thoughtful support for at-risk students, more than double their graduation rates in three years, and still capitalize on a high return on investment. And they use traditional remediation courses at the beginning of the program. Clearly these courses are not holding students back.
Scholars, policymakers, and practitioners need to realize that mislabeling an entire set of tiered, sequential courses as a barrier is not helpful. What is required instead is to thoughtfully support citizens throughout their time in higher education instead of cutting their access and opportunity to college.
References
Adelman, C. (1999). Answers in the tool box: Academic intensity, attendance patterns, and bachelor’s degree attainment. National Institute on Postsecondary Education, Libraries, and Lifelong Learning. http://files.eric.ed.gov/fulltext/ED431363.pdf
Adelman, C. (2004). Principal indicators of student academic histories in post-secondary education, 1972–2000. U.S. Department of Education, Institute of Education Sciences, National Center for Education Statistics. https://files.eric.ed.gov/fulltext/ED483154.pdf
Aldeman, C. (2009, November 3). Crossing the finish line: College dropouts. Education Policy Center Blog at American Institutes for Research. http://educationpolicy.air.org/edsector-archives/blog/crossing-finish-line-college-dropouts
Attewell, P., Lavin, D., Domina, T., & Levey, T. (2006). New evidence on college remediation. Journal of Higher Education, 77(5), 886–924. https://doi.org/10.1080/00221546.2006.11778948
Bahr, P. R. (2010). Revisiting the efficacy of postsecondary remediation: The moderating effects of depth/breadth of deficiency. Research in Higher Education Journal, 33(2), 177–205. http://debdavis.pbworks.com/f/revisiting+postsecondary+remediation.pdf
Bowen, W. G., Chingos, M. M., & McPherson, M. S. (2009). Crossing the finish line: Completing college at America’s public universities. Princeton University Press.
Cahalan, M., Perna, L. W., Yamashita, M., Ruiz, R., & Franklin, K. (2017). Indicators of higher education equity in the United States: 2017 trend report. Pell Institute for the Study of Higher Education, Council for Education Opportunity (COE) and Alliance for Higher Education and Democracy (AHEAD) of the University of Pennsylvania. http://pellinstitute.org/downloads/publications-Indicators_of_Higher_Education_Equity_in_the_US_2017_Historical_Trend_Report.pdf
Chen, X. (2016). Remedial coursetaking at U.S. public 2- and 4-year institutions: Scope, experiences, and outcomes (NCES 2016-405). U.S. Department of Education, Institute of Education Sciences, National Center for Education Statistics. https://nces.ed.gov/pubs2016/2016405.pdf
Gordon, L. (2016, November 9). Remedial courses are ‘barriers’ for many community college students, report says. EdSource. https://edsource.org/2016/remedial-courses-are-barriers-for-many-community-college-students-report-says/572483
Jaggars, S. S., & Stacey, G. W. (2014). What we know about developmental education outcomes. Community College Research Center, Teachers College, Columbia University. http://ccrc.tc.columbia.edu/media/k2/attachments/what-we-know-about-developmental-education-outcomes.pdf
McFarland, J., Hussar, B., de Brey, C., Snyder, T., Wang, X., Wilkinson-Flicker, S., Gebrekristos, S., Zhang, J., Rathbun, A., Barmer, A., Bullock Mann, F., and Hinz, S. (2017). The condition of education 2017 (NCES 2017- 144). U.S. Department of Education, National Center for Education Statistics. https://nces.ed.gov/pubs2017/2017144.pdf
National Student Clearinghouse Research Center. (2015). Snapshot report persistence-retention (Snapshot Report 18). https://nscresearchcenter.org/wp-content/uploads/SnapshotReport18-PersistenceRetention.pdf
Noble, J., & Sawyer, R. (2013). A study of the effectiveness of developmental courses for improving success in college. ACT Research Report Series. http://www.act.org/content/dam/act/unsecured/documents/ACT_RR2013-1.pdf
Schneider, M. (2010). Finishing the first lap: The cost of first-year student attrition in America’s four-year colleges and universities. American Institutes for Research. https://www.air.org/sites/default/files/AIR_Schneider_Finishing_the_First_Lap_Oct101.pdf
Shapiro, D., Dundar, A., Huie, F., Wakhungu, P.K., Yuan, X., Nathan, A. & Bhimdiwali, A. (2017). Completing college: A national view of student completion rates – Fall 2011 cohort (Signature Report No. 14). National Student Clearinghouse Research Center. https://nscresearchcenter.org/wp-content/uploads/SignatureReport14_Final.pdf
Yeado, J., Haycock, K., Johnstone, R., & Chaplot, P. (2014). Higher education practice guide: Learning from high-performing and fast-gaining institutions. The Education Trust. http://edtrust.org/wp-content/uploads/2013/10/PracticeGuide1.pdf
Zeidenberg, M., Jenkins, D., & Scott, M. A. (2012). Not just math and English: Courses that pose obstacles to community college completion (CCRC Working Paper No. 52). Community College Research Center, Teachers College, Columbia University. http://ccrc.tc.columbia.edu/media/k2/attachments/not-just-math-and-english.pdf