An Introduction to Community College Data
Alexandros M. Goudas (Working Paper No. 11) January 2019 (Updated January 2021)
This article is designed to put U.S. 4-year and 2-year college data into a broader context to help practitioners with proportions and distributions of introductory numbers in K-12 and higher education. Some of the numbers and percents are rounded for simplification. More will be added as this article is updated.
U.S. population: 337 million
Overall Numbers of Students
All K-12 students: 56.6 million (51 million in public schools, and 6 million in private schools)
All postsecondary students: 19.9 million
4-year postsecondary students: 13.3 million (67% or 2/3 of the total 19.9 million)
2-year postsecondary students: 6.7 million (33% or 1/3 of the total 19.9 million)
(USDOE, 2018a)
Overall Numbers of Institutions
All K-12 schools: 98,300 public schools (including 6,900 charters, and 34,600 private schools)
All postsecondary degree-granting institutions (Title IV): 4,600
All 4-year institutions: 3,000
4-year public: 700
4-year private: 2,300
All 2-year institutions: 1,579
2-year public: 910*
2-year private: 669
2-year nonprofit private: 87 (Cohen et al., 2014, p. 16)
All 2-year public and nonprofit private: 1065 (Cohen et al., 2014, p. 16)
(all data above from USDOE, 2017b except where noted otherwise)
*(data from Cohen et al., 2014, p. 16, Table 1.1 showed 978 two-year public colleges in 2011)
Analysis: According to Cohen et al. (2014), the number of two-year public and nonprofit private colleges in the US has not changed significantly since the late 1980s. Overall enrollment in terms of raw numbers in those colleges, however, has expanded significantly since that time. The share of postsecondary students attending community colleges has remained relatively stable (compare to percent listed above of total enrollment in institutions of higher education): “Community colleges had been organized in every state by the 1960s. By the mid-1970s, when the colleges enrolled 34 percent of all students in U.S. higher education, there were nearly eleven hundred institutions” (p. 38).
Completion Rates
High school graduation rate: 85% (USDOE, 2017a, 2018b)
Postsecondary enrollment rate directly after high school graduation: 69.8% (USDOE, 2018a)
4-year public graduation rate after six years: 58.31% (Shapiro et al., 2018)
2-year public graduation rate after six years: 39.22% (Shapiro et al., 2018)
2-year public graduation after eight years: 44% (Shapiro et al., 2017, p. 45)
Analysis: Aside from some recent fluctuations in 4-year college completion, these rates are the highest graduation rates from high school and college since data have been collected, especially for high school. Also, only recently have researchers begun to track 2-year public college students for eight years. Since many 2-year college students are part time, this 5-point rise in graduation rates should not be surprising. However, it is often not reported that so many more students graduate after 2 more years of tracking.
Retention Rates
4-year public retention rate overall (first-year students returning to the same institutions one year later): 68.8%
4-year public persistence rate overall (first-year students returning to any institution one year later): 79.3%
4-year public retention rate full-time (first-year students returning to same institution one year later): 79%
4-year public persistence rate full-time (first-year students returning to any institution one year later): 86.4%
4-year public retention rate part-time (first-year students returning to the same institution one year later): 39%
4-year public persistence rate part-time (first-year students returning to any institution one year later): 56%
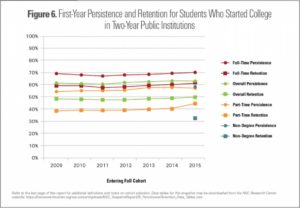
2-year public retention rate overall (first-year students returning to the same institutions one year later): 46.9%
2-year public persistence rate overall (first-year students returning to any institution one year later): 57.6%
2-year public retention rate full-time (first-year students returning to same institution one year later): 59%
2-year public persistence rate full-time (first-year students returning to any institution one year later): 66.7%
2-year public retention rate part-time (first-year students returning to the same institution one year later): 39%
2-year public persistence rate part-time (first-year students returning to any institution one year later): 52%
Analysis: Note that part-time 4-year and 2-year retention (students coming back the second year to the same institution) are almost identical. This suggests that the populations are similar in terms of common barriers such as a lack of support, monetary or otherwise.
(National Student Clearinghouse Research Center, 2015)
References
Cohen, A. M., Brawer, F. B., & Kisker, C. B. (2014). The American community college (6th ed.). Jossey-Bass.
National Student Clearinghouse Research Center. (2015). Snapshot report no. 18: Persistence-retention. https://nscresearchcenter.org/wp-content/uploads/SnapshotReport18-PersistenceRetention.pdf
Shapiro, D., Dundar, A., Huie, F., Wakhungu, P. K., Bhimdiwali, A., & Wilson, S. E. (2018). Completing college: A national view of student completion rates – fall 2012 cohort (Signature Report No. 16). National Student Clearinghouse Research Center. https://nscresearchcenter.org/wp-content/uploads/SignatureReport16.pdf
Shapiro, D., Dundar, A., Huie, F., Wakhungu, P. K., Yuan, X., Nathan, A., & Bhimdiwali, A. (2017). Completing college: A national view of student completion rates – Fall 2011 cohort (Signature Report No. 14). National Student Clearinghouse Research Center. Retrieved from https://nscresearchcenter.org/wp-content/uploads/SignatureReport14_Final.pdf
U.S. Department of Education. (2018a). Fast facts: Back to school statistics. National Center for Education Statistics. https://nces.ed.gov/fastfacts/display.asp?id=372
U.S. Department of Education. (2018b). Public high school graduation rates. National Center for Education Statistics. https://nces.ed.gov/programs/coe/indicator/coi/high-school-graduation-rates
U.S. Department of Education Digest of Education Statistics. (2017a). High school graduates, by sex and control of school: Selected years, 1869-70 through 2027-28 (Table 219.10). https://nces.ed.gov/programs/digest/d17/tables/dt17_219.10.asp
U.S. Department of Education Digest of Education Statistics. (2017b). Number of educational institutions, by level and control of institution: Selected years, 1980-81 through 2015-16 (Table 105.50). https://nces.ed.gov/programs/digest/d17/tables/dt17_105.50.asp
