The Best Community College Data: Sources for Reliable Research
Alexandros M. Goudas (Working Paper No. 8) December 2017
In order to assist educators, researchers, administrators, institutional research personnel, and others who are interested in finding the most reliable data on community colleges, this article provides summaries of and links to the best data currently available. The organizations cited in this paper are the sources researchers cite most frequently. One can rely on these organizations’ data to be some of the best possible information with which to make important decisions.
The only caveat one should keep in mind is that some of the recommendations these organizations make based on their data can and should be questioned. One should always conduct as much in-depth analysis of these numbers on one’s own before agreeing or disagreeing with researchers’ recommendations. Therefore, it is the intent of this article to provide access to these data for such purposes. The thoughtful, responsible analysis and use of any data is always the most effective approach when considering reforms and interventions.
USDOE, IES, and NCES Data
For some of the best raw data available, including some analysis and recommendations, the United States Department of Education (USDOE) provides easily accessible and free data on millions of postsecondary students and thousands of institutions. The Institute for Education Sciences (IES) and the National Center for Education Statistics (NCES) are probably even more helpful when it comes to delving into secondary and postsecondary numbers.
For example, the NCES Datalab allows researchers to search over thirty federal datasets. One can look into longitudinal data on postsecondary students in the PowerStats link on the right side of the Datalab’s website. The Community College Research Center (CCRC) and other organizations routinely collect and analyze data using the U.S. government’s tools.
As another example, the IES recently started the What Works Clearinghouse website. In order to be included on this site, studies are held to a higher standard. This means that studies are evaluated for rigor in several areas, such as methodology, research design, and statistical analyses. Only the best are included among these reports, and even those are assessed as being one of three ratings: strong, moderate, or minimal. Some studies are rated on a different scale of six total designations, from positive to mixed to negative.
Perhaps the most well-known and comprehensive reports the IES NCES releases yearly is called The Condition of Education. It is replete with data, and the subreports are very useful as well. For example, the Condition of Education 2008 provides a supplemental overview containing community college data. The most recent full report is the Condition of Education 2017. The section on postsecondary education begins on p. 241 and contains a large amount of useful information.
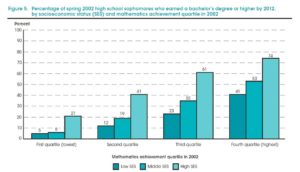
One of the most enlightening reports that can be found in this publication appears in The Condition of Education 2015. In a Spotlights brief based on the data from the full report (USDOE, 2015, p. 6, Figure 5), researchers highlight the varying postsecondary graduation rates of students who performed similarly on high school math tests. This chart shows that in spite of having the same abilities in high school math, students of low socioeconomic status graduate at a rate far below their wealthy counterparts. This suggests that knowledge in college course work alone is not enough to overcome SES barriers in college.
CCRC, NCPR, CAPSEE, and CAPR DATA
The Community College Research Center (CCRC) and its related organizations also provide very sound data. Dr. Thomas Bailey heads this organization, which is based out of Teachers College, Columbia University, and he also heads several other organizations: the National Center for Postsecondary Research (NCPR); the Center for the Analysis of Postsecondary Readiness (CAPR); and the Center for Analysis of Postsecondary Education and Employment (CAPSEE). Again, all four are headed by Dr. Bailey and often share the same researchers, themes, topics, conclusions, and philosophy. Nevertheless, much of the data and reports can be relied upon to be rigorous.
The only reservation one might have regarding the use of this data is that some of the CCRC and related organizations’ conclusions regarding remediation and developmental education should be taken with caution. I, along with other researchers, have disagreed with some of the conclusions the CCRC have drawn based on their data. It is an ongoing debate, but the raw numbers underlying the debate have never been questioned.
One can find a great deal of reports on two-year college issues at all four of these organizations’ websites. The CCRC and NCPR have been active for about a decade, and the other two organizations have recently been awarded five-year IES grants. Two governmental overviews supply a list of their articles or provide links to their research: CAPR received a five-year, ten million dollar grant from the IES in 2014, so their publications should continue to be released until 2019; CAPSEE received a five-year, ten million dollar grant from the IES as well, which was awarded in 2011 and thus completed in 2016.
National Student Clearinghouse Research Center Tracking Data
Perhaps the best source for tracking data in higher education currently is the National Student Clearinghouse Research Center (NSCRC). This independent nonprofit organization started about 25 years ago and offers transcript services to many institutions of higher education and to millions of students. Because of their business relationships with so many postsecondary institutions (mainly to do with transcripts and tracking students), they have been able to accrue a great deal of transcript-level data. They are therefore in the unique position to be able to track student progress using larger samples.
Recently they have begun to publish tracking data with numbers in the millions, providing researchers with more reliable data on where and when students graduate in the U.S. higher education system. For a long time now, most institutions have not been able to track students when they transfer. This makes it very difficult to know whether an institution is effective in achieving their purported goals. In other words, just because a transfer student did not graduate with a certificate or a degree from a two-year college, should that count against the institution in the data? Most institutions would include that student in the “did not graduate” column, a statistic that is not only inaccurate but misleading as well. Legislators and administrators are frequently making important decisions based on flawed data such as this.
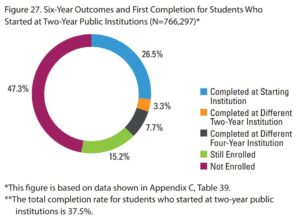
The Signature Reports, which began in 2011, are the most comprehensive tracking data researchers can find that show how many students graduate from various institutions. For example, on page 25 of the most recent Signature Report (#14), one can find data on how many students who started in a two-year public college actually graduated from their starting institution; how many transferred and graduated at another two-year college; how many transferred and graduated at a four-year college; how many remain enrolled; and how many are not enrolled. This paints a more clear picture of two-year public graduation rates. See Figure 27 below for a sample chart from this publication:
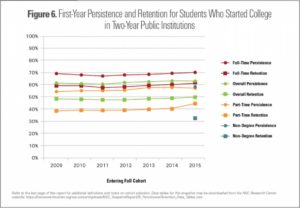
Additionally, the NSCRC has a subsection called Snapshot Reports, publications that are much shorter and have more concentrated data and charts. Regarding community college retention, for example, the NSCRC’s Snapshot Report 28 covers persistence and retention. Figure 6 (see below) highlights two-year public student data. “Persistence” is defined as a student who returns to any institution their second year (which thus includes transfer students), and “retention” is defined as a student who returns to the same institution their second year. Clearly, full-time students have a higher persistence rate than part-time students, a trend which is mirrored in the graduation rates one can also find in the Signature Reports.
Yet another Snapshot Report (#26) reveals how much two-year colleges impact four-year graduates. This is a very fascinating graph which more people in higher education should study and share. Two-year public colleges not only contribute to a large number of degrees and certificates at those institutions, but they also contribute to about half of all four-year graduates (average of all the states shown below: 49%).
![]()
Two Others Sources Worth Mentioning
There are, of course, many other institutions that conduct and disseminate sound and unbiased research on higher education. Two of them worth mentioning here are the American Institutes for Research (AIR) and the Georgetown University Center on Education and the Workforce.
To provide an example for each, AIR research on the value of a two-year degree can be found in a very good 2013 report. Another AIR report from 2013 demonstrates that students with technical associate’s degrees actually make more money than bachelor’s degree recipients in their first year after graduation. This result was found in multiple states.
A similar study from 2012 by GU’s Center on Education and the Workforce finds that students who graduate with certificates from two-year colleges earn much more than high school graduates, but earnings largely depend on the type of certificate. In addition, another 2012 study goes into depth about the various means by which students achieve sub-baccalaureate degrees, their earnings, and numerous charts and data to help educators understand the employment market for students who attain those degrees. There are many other publications on their website worth reading.
Using Data Thoughtfully
The resources and links in this article only point the way to the best data available on community college and postsecondary issues. For the most part, however, they do not provide researchers and decision-makers with an overall philosophy on how to use this data. It is extremely important then to consider all the possible ramifications of any intervention or reform before implementing it, even if it is “data-based.” As usual, a thoughtful and well-supported intervention will be more likely to help students to perform better than a hasty and underfunded reform. In fact, the metadata suggest that well-funded holistic reform is best; thus we must strive to use the existing reliable data to connect and support as many effective reforms as possible.
References
Contribution of two-year public institutions to bachelor’s completions at four-year institutions (Snapshot Report 26). (2017). National Student Clearinghouse Research Center. https://nscresearchcenter.org/wp-content/uploads/SnapshotReport26.pdf
First-year persistence and retention (Snapshot Report 28). (2017). National Student Clearinghouse Research Center. https://nscresearchcenter.org/wp-content/uploads/SnapshotReport28a.pdf
Kena, G., Musu-Gillette, L., Robinson, J., Wang, X., Rathbun, A., Zhang, J., Wilkinson-Flicker, S., Barmer, A., and Dunlop Velez, E. (2015). The condition of education 2015 (NCES 2015-144). U.S. Department of Education, National Center for Education Statistics. https://nces.ed.gov/pubs2015/2015144.pdf
Shapiro, D., Dundar, A., Huie, F., Wakhungu, P.K., Yuan, X., Nathan, A. & Bhimdiwali, A. (2017). Completing college: A national view of student completion rates – fall 2011 cohort (Signature Report No. 14). National Student Clearinghouse Research Center. https://nscresearchcenter.org/wp-content/uploads/SignatureReport14_Final.pdf
U.S. Department of Education, Institute of Education Sciences, National Center for Education Statistics. (2015). Postsecondary attainment: Differences by socioeconomic status. https://nces.ed.gov/programs/coe/pdf/coe_tva.pdf